Understanding how to use LinkedIn analytics in Taplio
Understand the stats and improve yourself based on data.
Note: the analytics section of Taplio is being entirely revamped. There may be a few problems with data fetching and this article may contain some inaccuracies. We are currently working on improving the experience.
Analytics are essential if you want to improve on LinkedIn. Figuring out what works and what doesn’t work will clearly take you to the next level, and for that, you can’t avoid going through analyzing your data.
But we know how data can be overwhelming, so we’ve kept things simple and actionable. We don’t want you to spend 5 hours dissecting what you can learn about every single piece of LinkedIn data you can find. We want you to spend 5 minutes doing that every month, and get the important information you need to find improvement opportunities.
Make sure Taplio Stats is installed
Note: if you have already installed it and can see data showing up in the My Stats section on Taplio, you can skip this entire section and go to the next one.
Start off by making sure the Taplio Stats Chrome extension is properly installed on your browser. You must make sure you have connected your Taplio account to the extension for the data to be sent to Taplio.
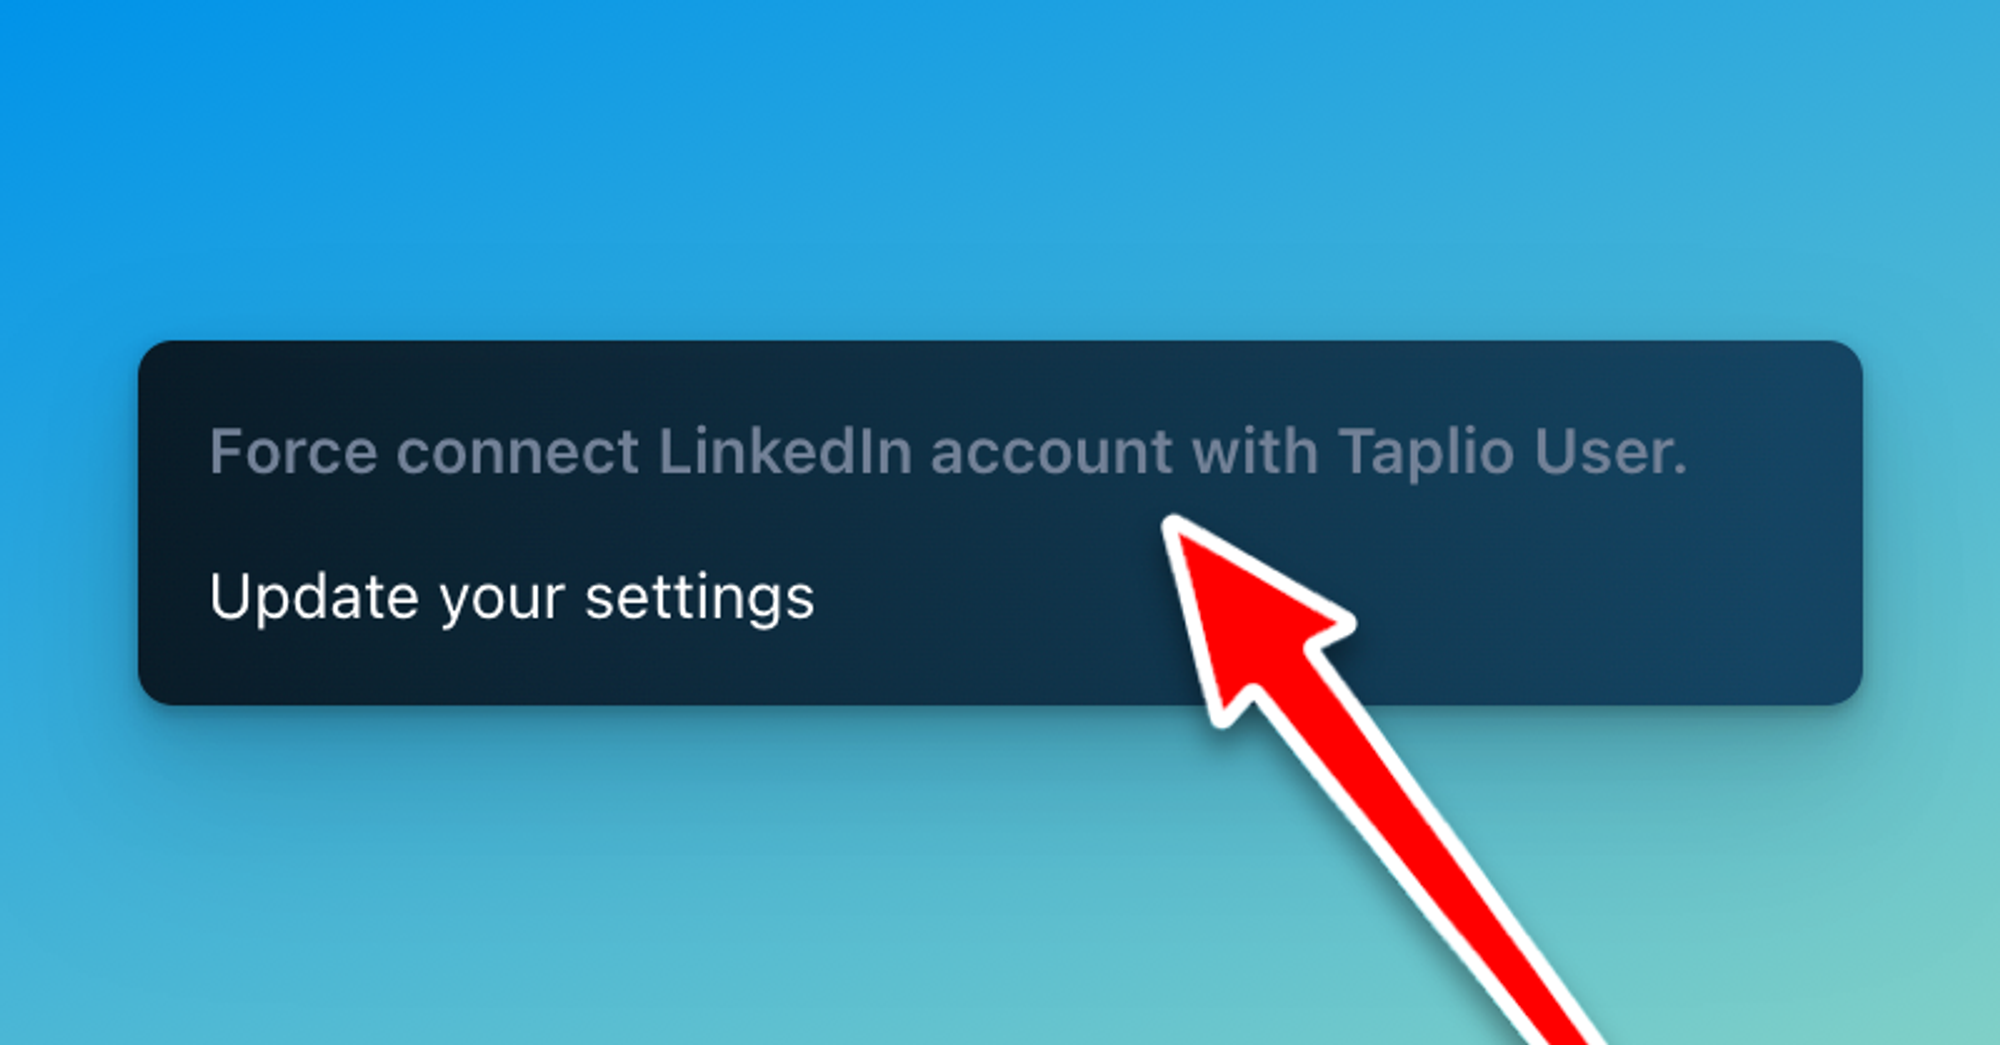
To do so, head over to LinkedIn.com after installing the extension. Open Taplio Stats and scroll down to the bottom of the screen to find the “Force connect LinkedIn account with Taplio user” text.
Click on it and follow the steps.
Give it a few minutes and head back to the My Stats section in Taplio where you should start seeing some data.
Understanding the data and using it to improve
Note: You can use the date picker at the top-right corner of the page to set the dates you want to analyze.
Your main LinkedIn KPIs at a glance
The first section on the My Stats page is your main LinkedIn statistics:
- Followers
- Impressions
- Engagement
- Profile Views
- Number of posts you published
- Likes
- Comments
- Shares
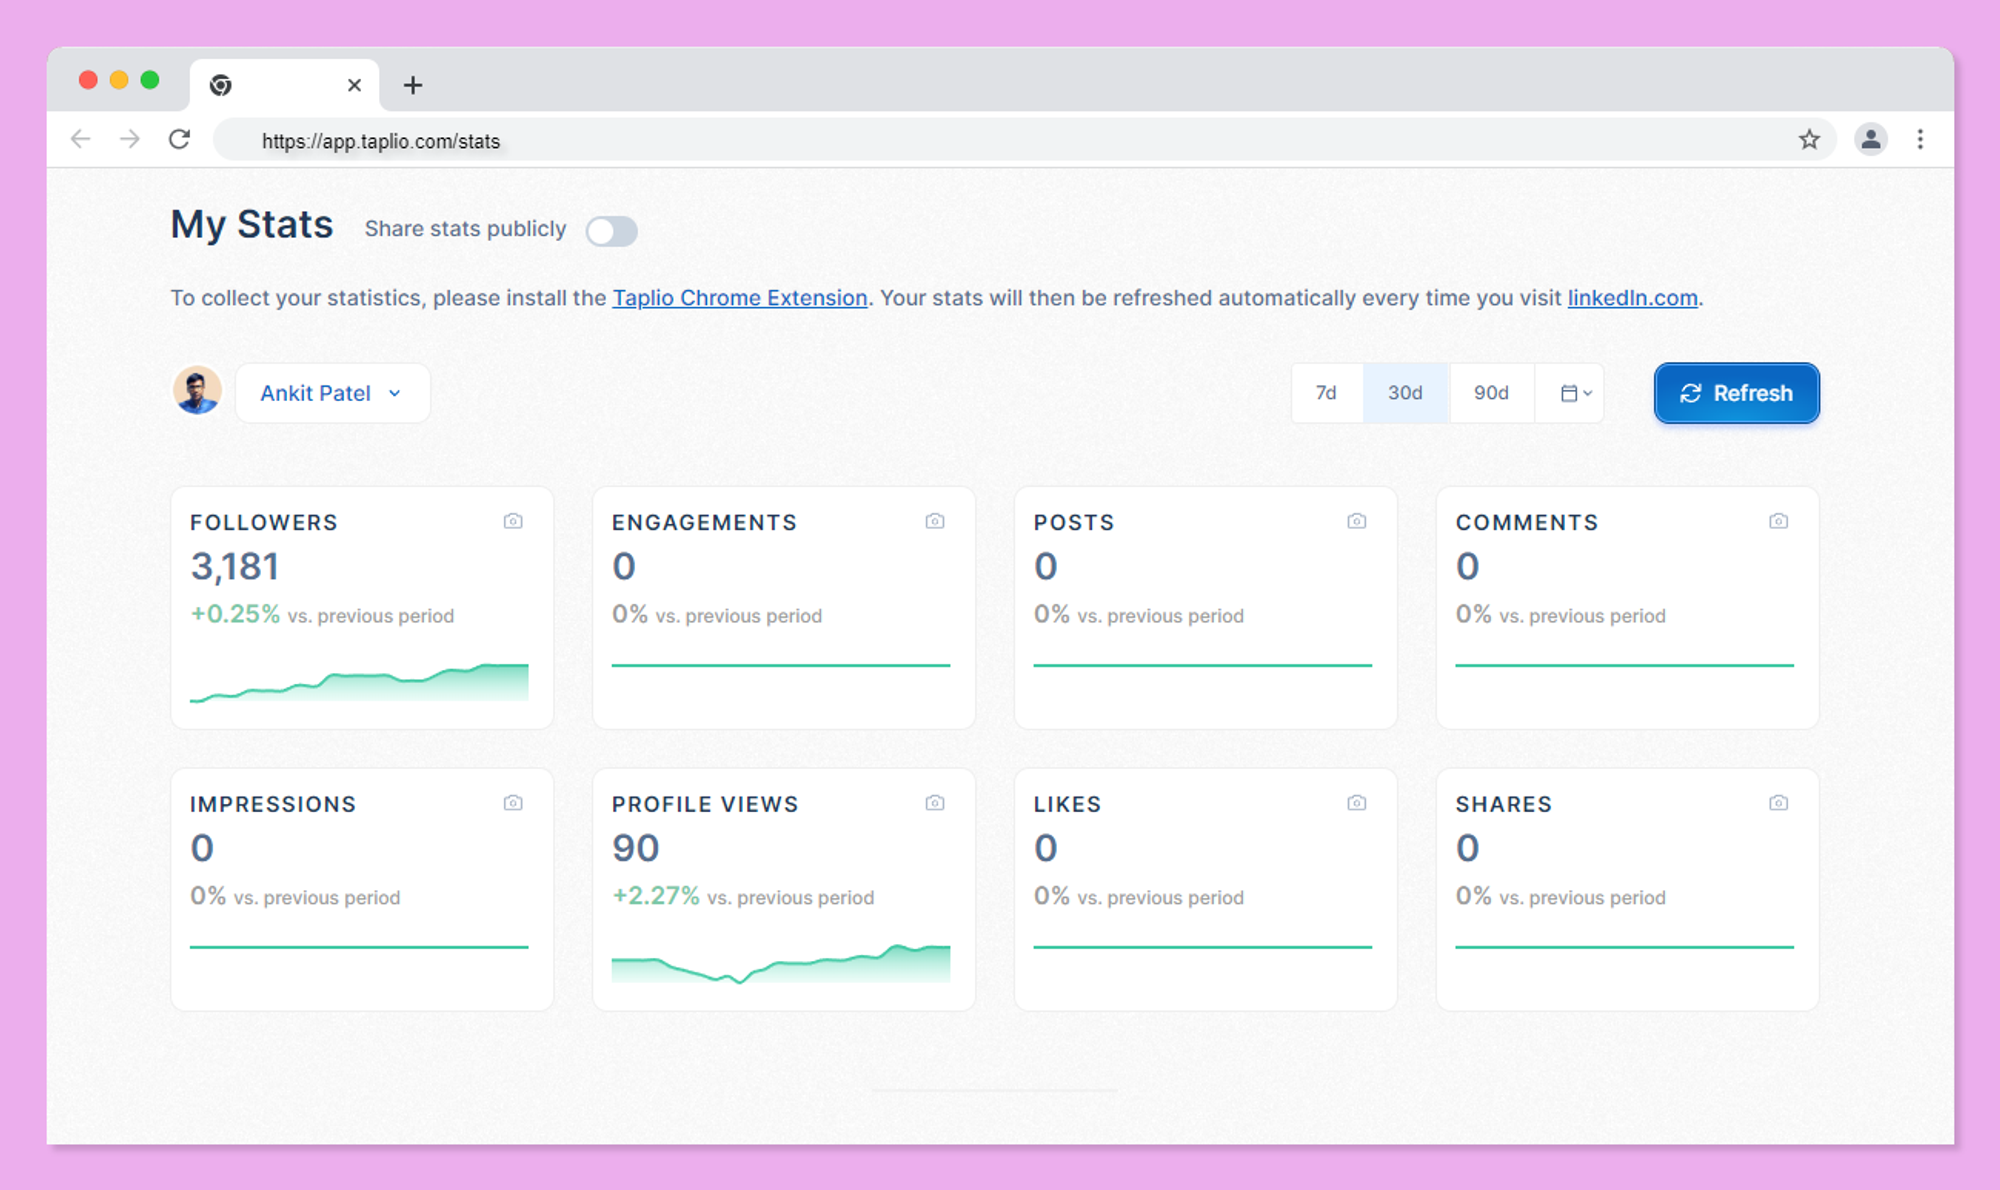
The goal of this section is to show you all the important things about your activity and performance on LinkedIn.
If you want to deep dive into a specific KPI, just click on the tile and it will open a detailed graph below which you can visualize as a line chart or a bar chart depending on how you prefer to see your data.
Posts that generated the most…
If you want to know what posts performed best in approximately 3 seconds, this section is the most adapted for you.
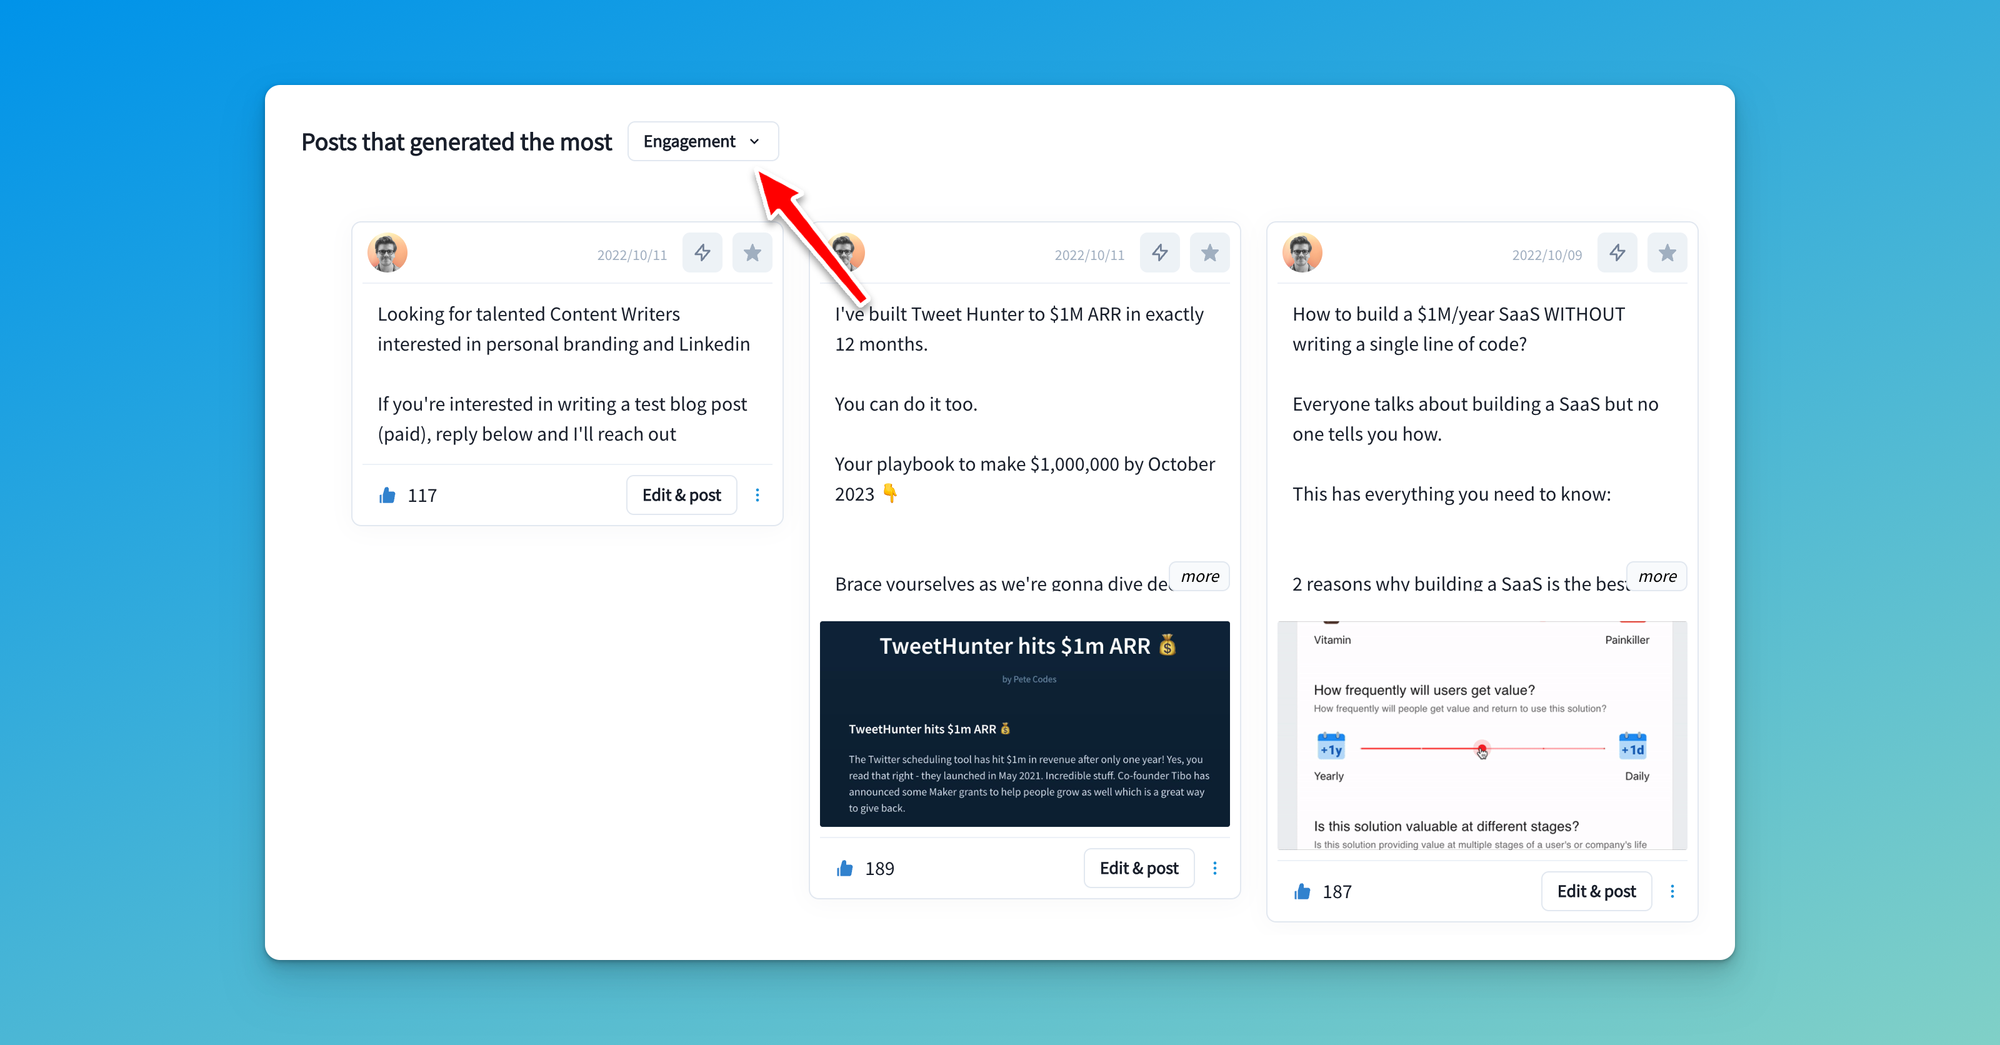
Just pick a metric, and see what posts delivered the best results for that metric over the time period you selected.
Once you have figured that out, you can use that information to reproduce more similar posts which are going to drive results for the metric you are looking to improve.
Detailed Posts performance
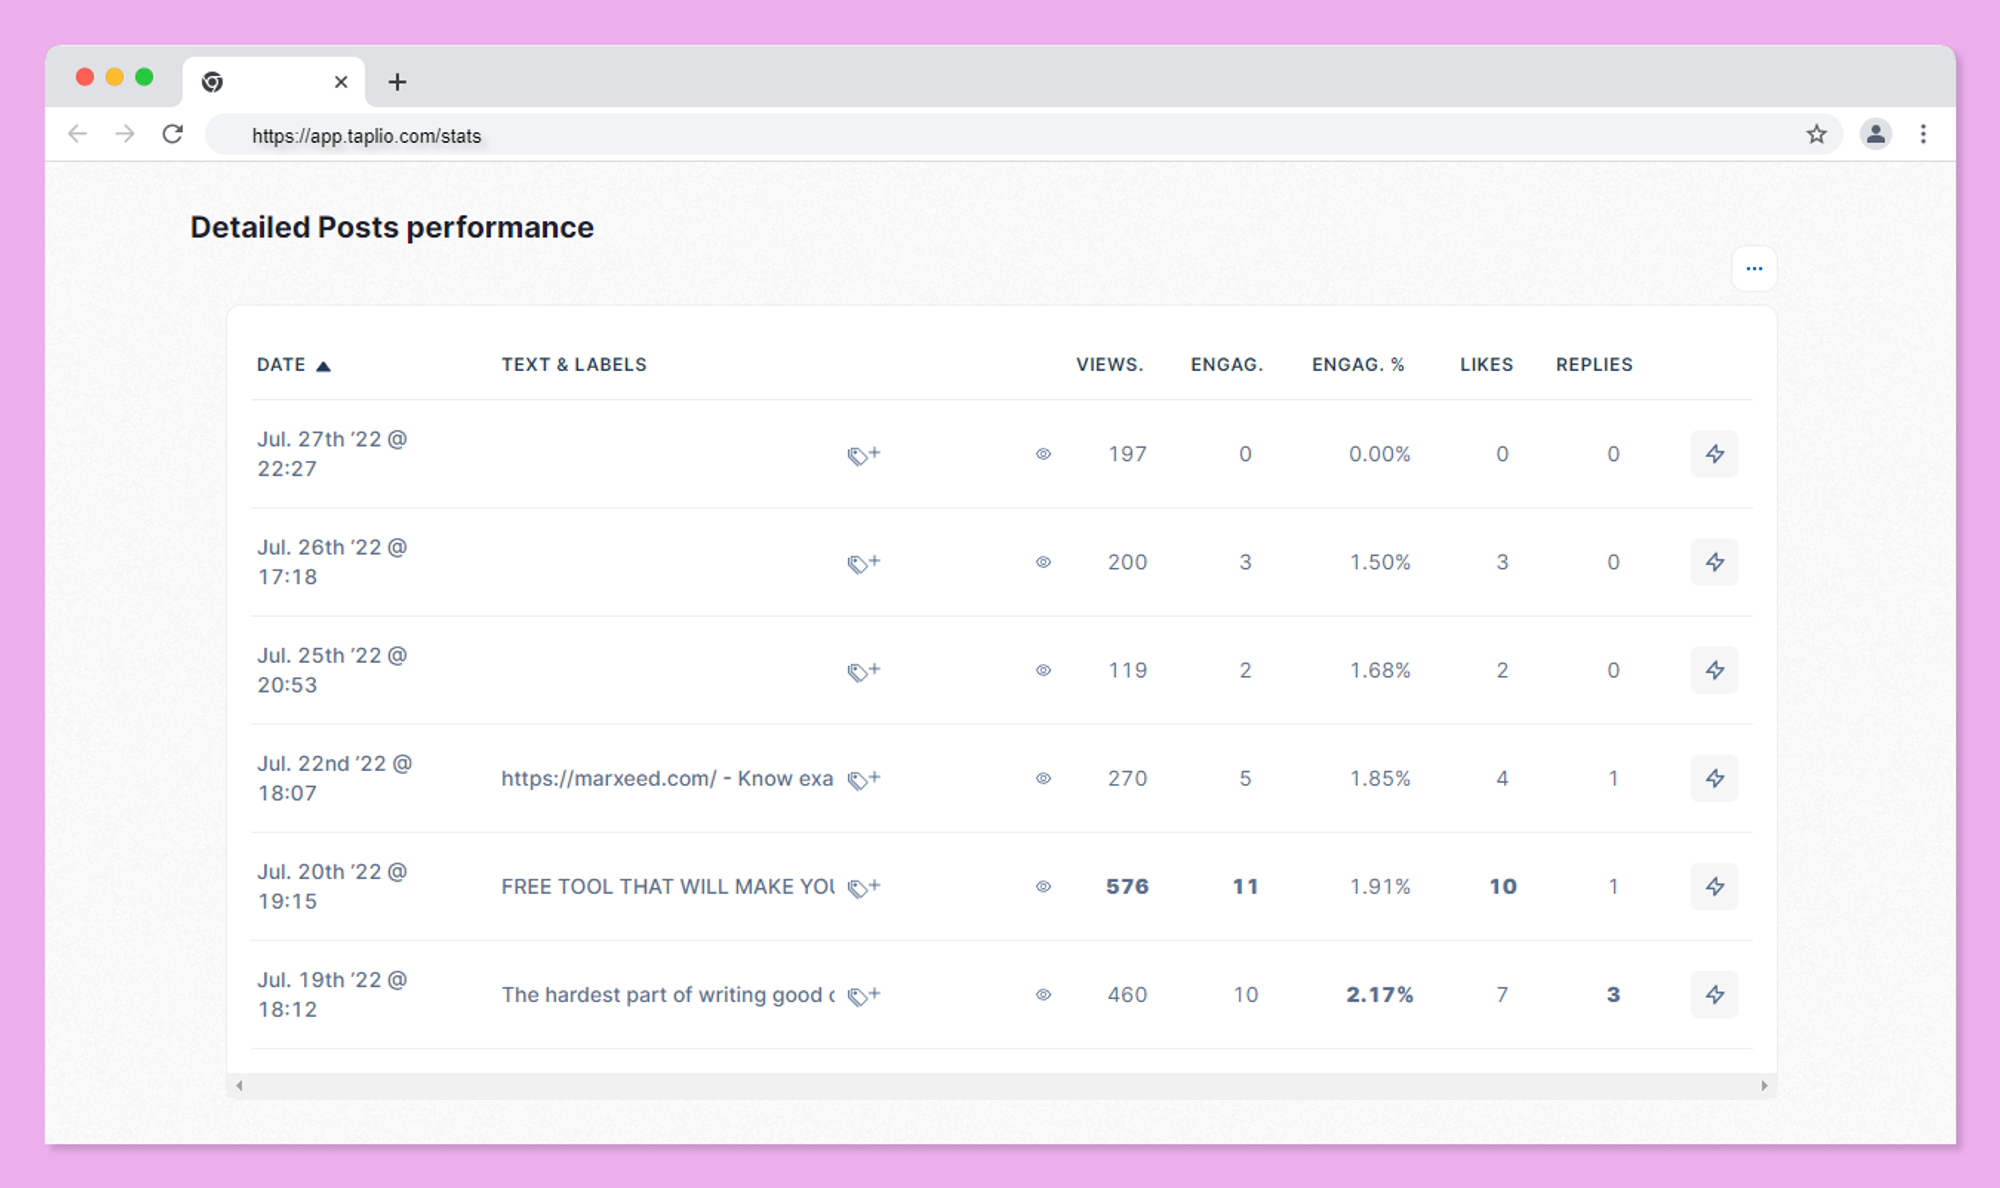
This is where you can go deeper into the specifics of each post. All important metrics are there, and you can sort the table so that the best-performing posts for each metric come up on top.
If you find a post that delivered great performance and you’d like to write a variation of it, you can use the ⚡️ icon on the right of the table which will ask our AI to re-write the post for you. Just make sure you have the post composer open because that’s where the requested variation will be displayed.